SQUIRE Barber Trends & Insights Report
The State of Barbershops 2026
A year inside the chairs, the books, and the data. What's driving growth, what's costing shops, and where the industry is headed next — from May 2025 through April 2026.
- Coverage Window
- May 2025 – Apr 2026
- Shops Analyzed
- 7K*
- Regions
- 4 U.S. Divisions
- Appointments
- 13.9M
*Shop count reflects all U.S. shops with paid appointments during the coverage window (military shops excluded). Some metrics elsewhere in this report are filtered to shops that operated for the full 12-month cohort period (May 2025 – April 2026), representing 9.79M appointments across 2,224 shops
The Thesis
The modern barber is more than a barber.
The shops separating themselves in 2026 aren't just busy — they're building. Today's top-performing barbers and owners wear more hats than ever: managers, marketers, community leaders, customer experience liaisons, business owners, and content creators. The chair is just where it starts.
01.
Manager
Running the shop like a business — scheduling, payroll, inventory, performance.
02.
Marketer
Building a local brand on Instagram, TikTok, and Google reviews.
03.
Community Leader
Anchoring blocks, neighborhoods, and culture — not just clientele.
04.
CX Liaison
Owning the booking-to-tip experience from first DM to the chair.
05.
Entrepreneur
Expanding into multi-shop ownership, partnerships, and product.
06.
Content Creator
Turning fades into followers, and followers into a fully booked Saturday.
A Century of the Chair
From two bits to forty-three bucks.
The price of a haircut has climbed nearly 17,000% in 125 years — and the pace is accelerating. Here's how the average ticket has moved.
-
1900
$0.25
'Two Bits'
-
1960
$1.85
Post-War Standard
-
2000
$20
Pre-Digital Era
-
2026
$43
National Average
+97.5% since 2000 – still trailing rent & housing inflation.
Source: Medium (Rafael Sprouse, "Haircut Prices vs. Inflation"); OfficialData.org Apparel & Service CPI.
Part One
More Clients
The strongest shops today are growing through retention, reputation, relationships, referrals, and community trust — not chasing strangers.
Trend 01
Retention is the real growth driver.
The fastest-growing shops on SQUIRE in 2025–2026 aren't running ads for strangers. They're winning the rebook. Repeat behavior — not new acquisition — is what's separating the top quartile from the rest of the field.
Across the platform, the shops compounding hardest are the ones building routines: consistent visits, faster rebook cycles, and a service mix that gives every regular a reason to come back sooner.
Our business is built on repeat customers, and Engage ensures we never miss a beat. The fact that almost every single appointment booked through these campaigns is from a returning client tells us one thing: Engage is the ultimate customer loyalty engine. We don't just book appointments; we reinforce relationships.
*Returning clients measured at the shop level: 44.63% of all visits come from a client who previously visited that same shop.*About 48% of SQUIRE clients are one-and-done (single appointment). Avg. time between visits only counts clients with more than one appointment. For context, the average client gets ~7 haircuts a year.
Internal source: SQUIRE platform data, May 1, 2025 – April 30, 2026. External: industry consumer convenience benchmarks.
44.63%*
Returning clients
48.5 DAYS*
Avg. Time Between Visits
94.2
Avg. Appointments per Month per Barber
76%
Of clients rank booking convenience equal to service quality
Trend 02
Reputation = revenue.
The modern storefront isn't your front door anymore. It's the search result. In 2026, online reputation has evolved beyond a basic star rating. It is entirely driven by three metrics: volume, recency, and consistency. Across America's 25 largest markets, 83% of barbershops already rate 4.5 stars or above. Your local competitors have great ratings — and so does everyone else.
Star ratings have officially converged. Sitting at a 4.5 is no longer a true differentiator; it is simply table stakes. The shops dominating local discovery are the ones treating review generation as a system rather than an afterthought. By automating the ask at checkout, top-tier shops build an unassailable data gap: shops running an automated review system accumulate 84% more reviews on average than those operating manually. In the top 10 U.S. metropolitan markets, that performance gap widens to 117% more reviews. That massive gap is exactly what dictates search algorithms, positions you at the top of local rankings, and converts a client before they ever look at your chair availability. Reputation is revenue. But in 2026, you don't build it just by being good at your craft — you build it by showing up consistently at the top of every search result.
Google reviews are a lot of people's first impression of you. I go and look at those every day — I tell my guys, to everyone who hasn't been here before, you are who your Google reviews say you are, whether you want to believe it or not.
Source: web scrape of Google reviews, top 25 U.S. metros by shop count, 17,913 shops analyzed.
83%
Of shops across the top 25 U.S. metros rate 4.5 stars or above
37%
Rate 4.9–5.0 stars — the new competitive ceiling
2%
Of shops rate below 4.0 — effectively invisible in search
84%
More reviews on average for shops using a review system vs. those that don't
45%+
Of shops rate 4.9 or above in Miami, Tampa, and Orlando
Part Two
More Control
The best shops are not simply busy — they have better systems, sharper visibility, and tighter command of their time and money.
Trend 03
Busy doesn't mean profitable.
Peak hours are not the same as peak revenue. The shops at the top of our data set aren't the busiest — they're the most optimized. They know which windows pay, which services move the ticket, and where every hour leaks.
Analog shops are still bleeding time at the front desk. Pen-and-paper operators lose an average of 5-10 hours per week to admin — essentially a full missing workday — and face no-show rates as high as 20%. Automated reminders and deposits drop that number by 89%.
Before moving to Squire, I only knew what I personally claimed on my taxes. I had no record of what the business as a whole earned. With the reporting, my understanding of the business's value went from nothing to something. Now I can walk into a bank or a lawyer's office with real numbers.
*External: Business Research Insights — Barber Shop Software Market Outlook 2026–2035, Why 72% of US Salons are Ditching Manual Booking, How the Right Restaurant Software Saves 100 Hours a Year, The Hidden Costs of a Paper-Based Office
62%
Schedule Utilization
30 MIN
Avg. Service Length
5-10 HR
Weekly admin lost to pen & paper
-89%
No-shows w/ automated reminders
In 2025, shops using Book & Pay protected an average of $4,300+ per month.
Calculate your no-show costsTrend 04
Pricing power is regional.
There is no universal price for a haircut anymore. What clients pay — and tip — varies dramatically by region, density, and how mature the local market is. The shops that win price their service against their block, not a national average.
$43
U.S. Avg. Cut · 2026
$40
Northeast Avg.
$40
South Avg.
$35
Midwest avg.
$45
West Avg.
Regional Deep Dive
The map of modern barbering.
Click a region to see how pricing, tipping, retention, and demand shift across the country. The differences are bigger than most owners think.
Avg. cut price excludes tax and tip but includes owner-added fees (e.g., card-processing surcharges). Schedule utilization is calculated at the shop level using each barber's 90th-percentile availability — for example, a shop open 8am–8pm with two barbers on the floor counts as 24 barber-hours of capacity in the denominator.
Part Three
More Clarity
Technology is not a feature anymore — it is the line between reactive and scalable.
Trend 05
Technology is creating separation.
The shops adopting AI, automation, referrals, and digital booking are pulling away from the ones still running on memory and missed calls. The gap isn't subtle anymore. It's measurable in revenue, retention, and time off the floor.
Pre-2020, only 15–20% of barbershops used sophisticated booking software. COVID compressed ten years of adoption into three. Today, 72–77% of shops use management software — and over 90% of new shops launch digital-first.
Squire has been a huge help for our marketing and overall operations. It's taken a lot of stress off our team by automating tasks that used to be time-consuming, and we've seen real results — sales are up, clients are returning more often, and everything runs more smoothly. Having better insight into our marketing performance has been a game-changer for how we grow our business.
*SQUIRE Shops Using AI Features: 57.98% — excludes individual barbers (indies). Calculated from operator onboarding completion, Engage AI events, and AI reporting bot events.
Internal data: SQUIRE platform telemetry. External: Business Research Insights — Barber Shop Software Market Outlook 2026–2035, Why 72% of US Salons are Ditching Manual Booking, How the Right Restaurant Software Saves 100 Hours a Year, The Hidden Costs of a Paper-Based Office
+34%
Revenue lift after software adoption
72–77%
Of shops now use management software
57.98%*
SQUIRE Shops Using AI Features
3+
Number of customer-facing channels used by the average shop on Squire
~2 in 3
Bookings happen through customer self-service
~25%
Of self-service bookings happen between 6 pm–midnight
Trend 06
THE 5 O'CLOCK CUT IS GONE.
Peak weekday booking hour moved from 5pm to 4pm. The after-work rush flattened — and the workday filled in. 92% of weekday cuts now happen between 8am and 5pm
Workday hours · Mon–Fri 8a–5p
+5.85PP
Non-work weekday · early/evening
-5.06PP
Weekend · Sat & Sun
-0.79PP
Source: SQUIRE platform data · weekday Mon–Fri averages · Pre-2020 baseline vs. post-2020 distribution.
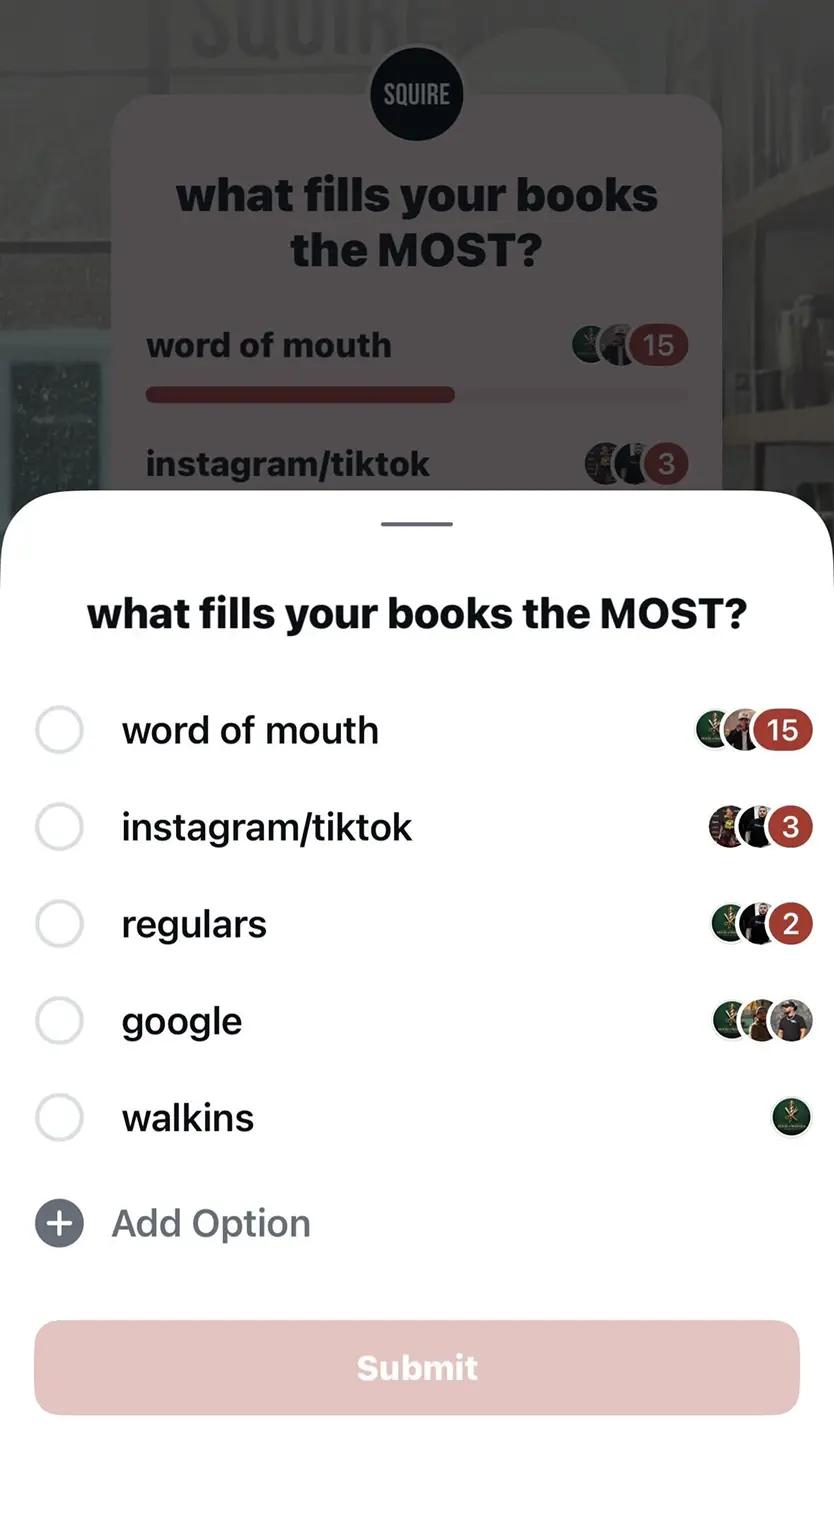
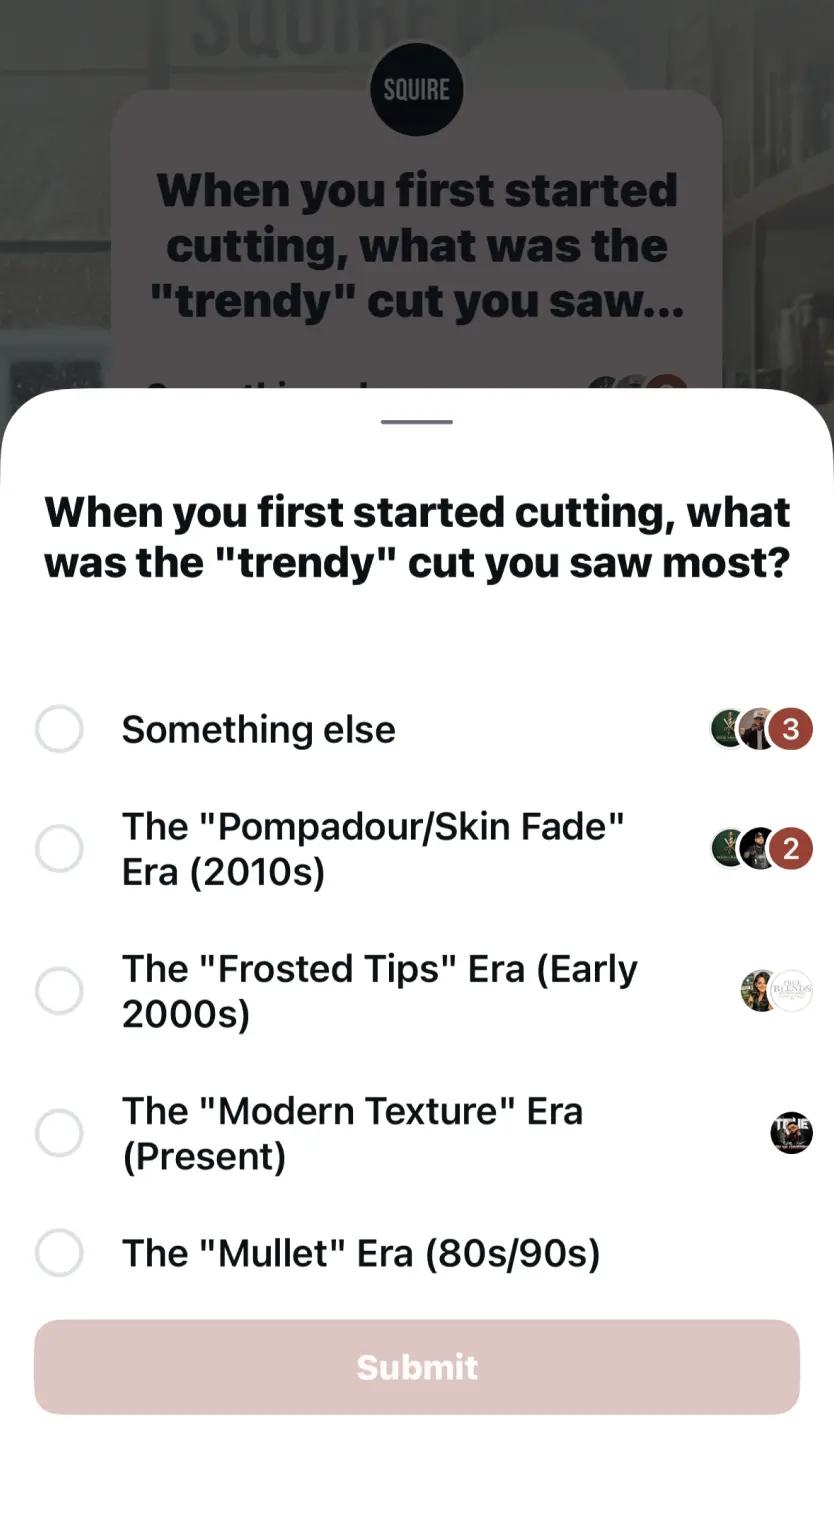
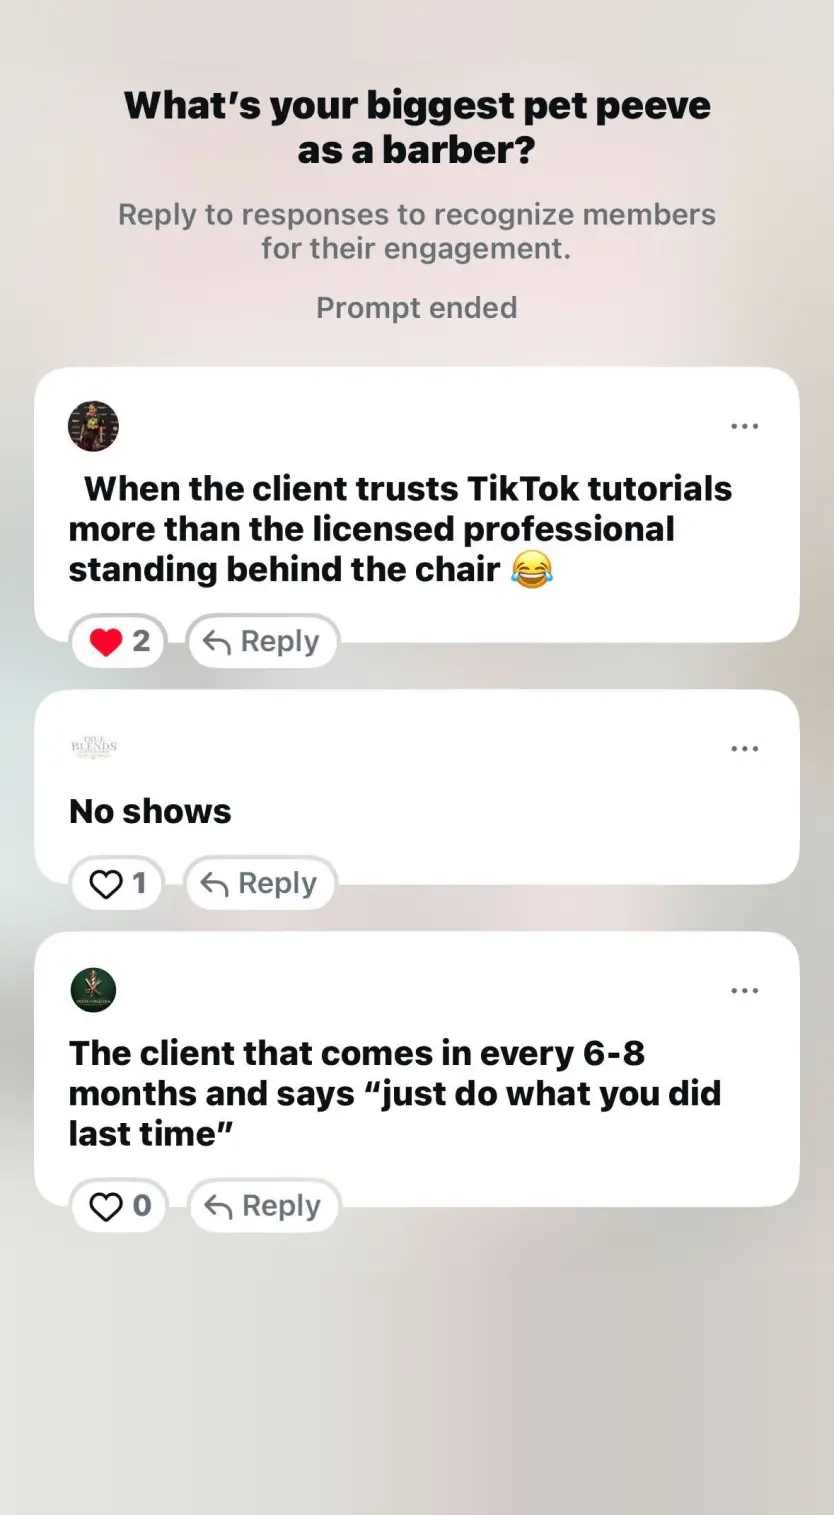
We Asked The Squad
Straight from the chair.
Real answers from SQUIRE barbers and shop owners. Live polls run via Instagram.
The Next Era
What comes next.
The next generation of successful barbershops will balance craft, customer experience, operational intelligence, community, and technology. The shops embracing that shift early are already pulling ahead — and the data shows it widening every quarter.
Craft
Experience
Intelligence
Community
Technology
22.1%
Of the barber workforce is female
$0.99
Earned per $1, female vs. male barbers
$154K+
Top 10% professional barber earnings
$500K+
High-performing owner/influencer ceiling
External: Data USA (BLS & Census 2024); Glassdoor 2025; Supreme Trimmer Industry Report; Booksy Biz Salary Analysis.
Let's Talk
See what your shop could do.
Every trend in this report plays out a little differently in every shop. Reach out and our team will walk you through what SQUIRE could do for yours.